

Your Amazon EC2 instance hanging unresponsively due to unknown reasons is a wrath of God that can happen easily. At first look, Amazon CloudWatch (their monitoring system) has got you covered with all the default metrics. Upon closer inspection, this is not true! The two most important factors are hidden inside the virtual machine: memory usage and free disk space. Let’s expose that data! Why? Max out either, and your instance will be on its knees instantly. When EC2 memory usage hits the roof, the CPU will spike as a cascading result, leaving you wondering what’s going on. Nothing, it’s “just” insufficient memory. Furthermore, you can run out of disk space due to underprovisioning and garbage filling your precious storage. I’ll show you how we monitor EC2 memory and disk usage with the least amount of effort, on an Ubuntu system.
Our use case has custom metrics for monitoring two EC2 instances (production and development). Both use the same Amazon Machine Image (AMI) for WordPress. They are Ubuntu systems that have OpenLiteSpeed as the web server. This tutorial is based on the official documentation but is dumbed-down to focus on the least possible steps with the recommended configuration.
Hold up, are custom metrics free?
Amazon has very clear pricing, but due to the sheer amount of services and variations of such services, it’s easy to get lost. The pricing examples for tens of thousands of EC2 instances at the cost of a Tesla every month aren’t helping. 🤣 At least you can rest assured they are equipped to handle your workload. When you can’t figure out how much things will cost you using pricing tables, I recommend their new calculator.aws and/or the older “Simple” Monthly Calculator. So, is it free to add a handful of custom metrics? To the extent of the free tier, yes:
Each month, new and existing Amazon CloudWatch customers receive 10 metrics (applicable to Detailed Monitoring for Amazon EC2 instances or Custom Metrics), 10 alarms, 5 GB of ingested log size, 5 GB of archived log size, 3 dashboards and 1 million API requests each month at no additional charge.
AWS Identity and Access Management
Let’s get the credentials for the script that will periodically send data to CloudWatch. But first, you need an IAM policy attached to an IAM user.
The IAM policy
To begin, open the IAM Management Console, then click Policies -> Create policy. Copy paste the following to the JSON tab.
{
    "Version": "2012-10-17",
    "Statement": [
        {
            "Sid": "VisualEditor0",
            "Effect": "Allow",
            "Action": [
                "cloudwatch:PutMetricData",
                "ec2:DescribeTags",
                "cloudwatch:GetMetricStatistics",
                "cloudwatch:ListMetrics"
            ],
            "Resource": "*"
        }
    ]
}- Click Review policy, so that you can name it like MonitorEC2 (with an optional description).
- The Create policy button will end this madness.
The IAM user
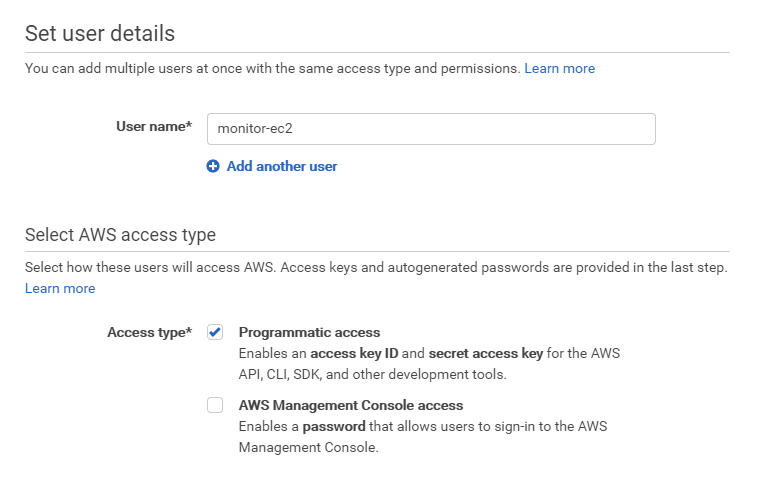
Go to Users -> Add user. Tick the box next to programmatic access!
On the Permissions screen, choose to Attach existing policies directly and to access the policy you created, filter by policy type: Customer managed.
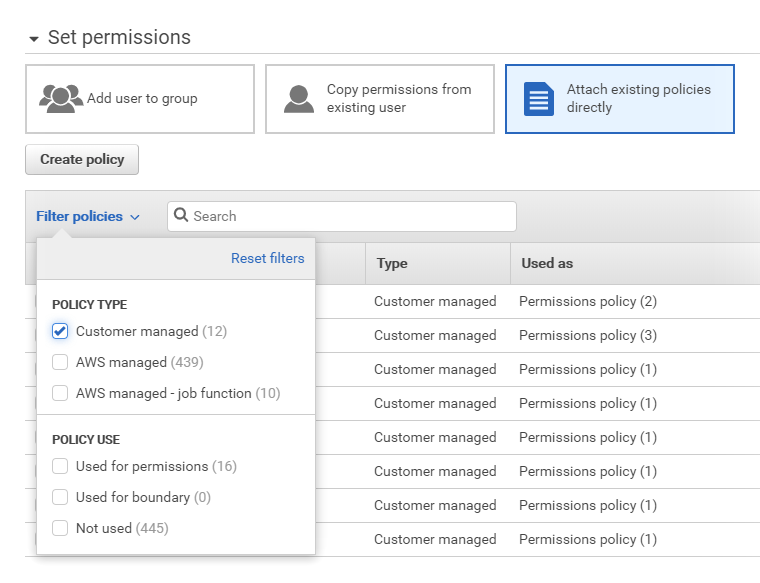
- Once you found it, tick the box next to it so you can proceed with Next, Next, Create user.
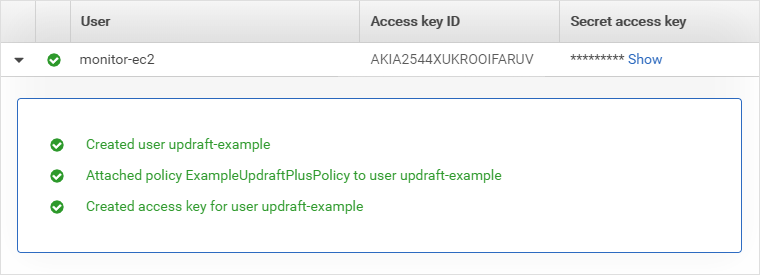
- Make a note of the Access key ID, and Secret access key.
Installation
Dependencies
Connect to your EC2 instance over SSH. Install dependencies with the following (no need to prefix with sudo if you are root):
sudo apt-get install libwww-perl libdatetime-perlThis will install a lot of other Perl-based dependencies and may ask you to restart some services.
The monitoring script
It’s worth taking a peek at the download page of Amazon CloudWatch Monitoring Scripts for Linux. It explains what each file does, and you could inspect them to see how they work, before installation.
Once ready, run this to download the ZIP file into your home folder:
wget https://aws-cloudwatch.s3.amazonaws.com/downloads/CloudWatchMonitoringScripts-1.2.2.zipThis bunch will uncompress and remove the ZIP, enter its directory, rename the credentials template and begin editing it:
unzip CloudWatchMonitoringScripts-1.2.2.zip
rm CloudWatchMonitoringScripts-1.2.2.zip
cd aws-scripts-mon
mv awscreds.template awscreds.conf
nano awscreds.conf
Credentials
Use the Access Key ID and the Secret Key of the IAM user similar to this:
AWSAccessKeyId=AKIA2544XUKRHWRL54IT
AWSSecretKey=3x4mp13/5Pdc2z83wOK1XDMPI/sGGlo+NyBM4fIn
Use the actual credentials you created, not these examples (they don’t work). Press Ctrl+X then Y, and finally Enter to save and exit.
Configuration
I cherry-picked the following configuration options. For more information, refer to the documentation. For memory usage, I choose not to include caches and buffers, as they aren’t part of what you’d call used memory (see why at Linux ate my RAM!).
Metrics
--mem-utilMemory utilization %.--mem-usedMemory used in MB.--disk-space-utilDisk space utilization %.--disk-space-availFree disk space in GB.
Additional options
--disk-path=/Mandatory! This picks the NVMe SSD storage for reporting, which is at the core of Amazon Elastic Block Store (Amazon EBS). It’s the primary storage for your EC2 instance, and you pay for its provisioned size (not the actual usage).--from-cronSuppresses output when scheduled.- For testing, use
--verify --verboseto simulate and see what’s up.
Testing
Run this command for testing:
./mon-put-instance-data.pl --mem-util --mem-used --disk-path=/ --disk-space-util --disk-space-avail --verify --verboseIf you are AWSome, this is what it tells you:
Verification completed successfully.
No actual metrics sent to CloudWatch.
Along with a bunch of JSON mumbo jumbo, which looks quite useful when formatted properly:
{
  "Namespace": "System/Linux",
  "__type": "com.amazonaws.cloudwatch.v2010_08_01#PutMetricDataInput",
  "MetricData": [
    {
      "Value": 34.6872348564993,
      "Dimensions": [
        {
          "Name": "InstanceId",
          "Value": "i-1234567890abcdef0"
        }
      ],
      "Unit": "Percent",
      "MetricName": "MemoryUtilization",
      "Timestamp": 1561651397
    },
    {
      "Timestamp": 1561651397,
      "Dimensions": [
        {
          "Name": "InstanceId",
          "Value": "i-1234567890abcdef0"
        }
      ],
      "Unit": "Megabytes",
      "MetricName": "MemoryUsed",
      "Value": 634
    },
    {
      "Timestamp": 1561651397,
      "Dimensions": [
        {
          "Name": "Filesystem",
          "Value": "/dev/nvme0n1p1"
        },
        {
          "Name": "InstanceId",
          "Value": "i-1234567890abcdef0"
        },
        {
          "Value": "/",
          "Name": "MountPath"
        }
      ],
      "Unit": "Percent",
      "MetricName": "DiskSpaceUtilization",
      "Value": 44.7727177314002
    },
    {
      "Value": 8.51539993286133,
      "Timestamp": 1561651397,
      "MetricName": "DiskSpaceAvailable",
      "Dimensions": [
        {
          "Name": "Filesystem",
          "Value": "/dev/nvme0n1p1"
        },
        {
          "Name": "InstanceId",
          "Value": "i-1234567890abcdef0"
        },
        {
          "Value": "/",
          "Name": "MountPath"
        }
      ],
      "Unit": "Gigabytes"
    }
  ]
}
As you can see, the script does everything for you, such as naming custom metrics. You’ll just need to find and select these later in the management console to see them graphed. These are four metrics for EC2 memory and disk usage. Even if you have two instances, that’s 8/10 of the free limit.
CRON setup
Adding the command to the cron ensures CloudWatch will receive the above data every 1-5 minutes. Begin with this:
crontab -eIf it wants you to choose an editor, pick nano (1 and Enter). The (no longer test) command is part of the line you need to add:
*/5 * * * * ~/aws-scripts-mon/mon-put-instance-data.pl --mem-util --mem-used --disk-path=/ --disk-space-util --disk-space-avail --from-cronPress Ctrl+X then Y, and finally Enter to save and exit. From now on, cron will run the command every 5 minutes. If you want a minute-based resolution use */1 in the beginning.
Show EC2 memory and disk usage on CloudWatch
Go to CloudWatch Management Console. While you set up a custom Dashboard, the values will start rolling in. The graph widgets won’t be that beautiful in the beginning, but over time, they become more meaningful. To see that the data is arriving, go to Metrics -> Custom Namespaces -> Linux System.
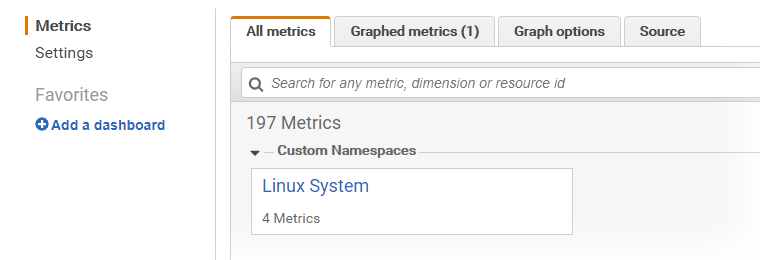
Explore which metric is where! CloudWatch shows a graph when you choose a row. I understand this clicking around might be chaotic to check the charts whenever you need to. That’s why I created a dashboard.
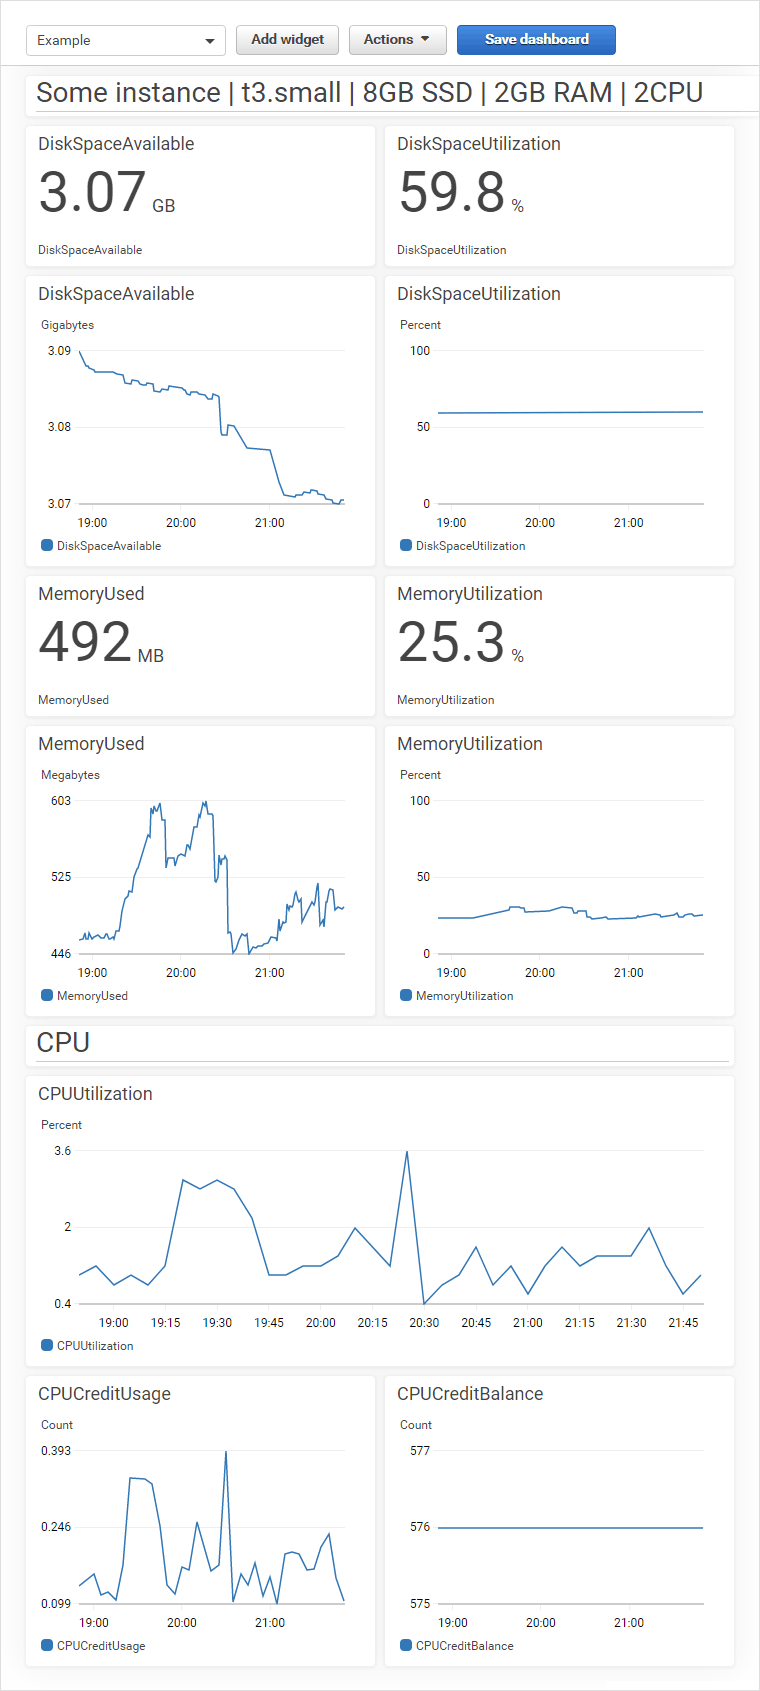
Putting together a custom dashboard
All the above was almost for nothing unless you create a beautiful interface for these essential metrics. I’ll guide you through the process of creating a single chart. You may repeat it as many times you need, depending on which metrics you wish to see and in what arrangement. That’s entirely up to you, but we needed EC2 memory and disk usage; and CPU Utilization, Credit Usage, Credit Balance:
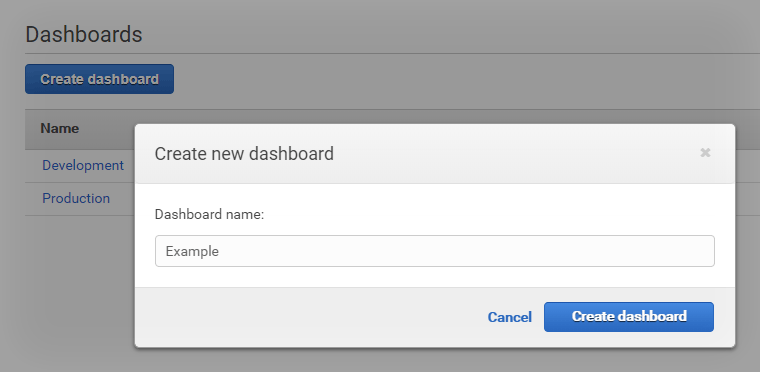
Create a new one by going to Dashboards -> Create dashboard and enter a name. For example, Production or Development.
A single widget
To create one piece of the puzzle, start by choosing the Line type. This dialog hides behind the Add widget button (who would have thunk?).
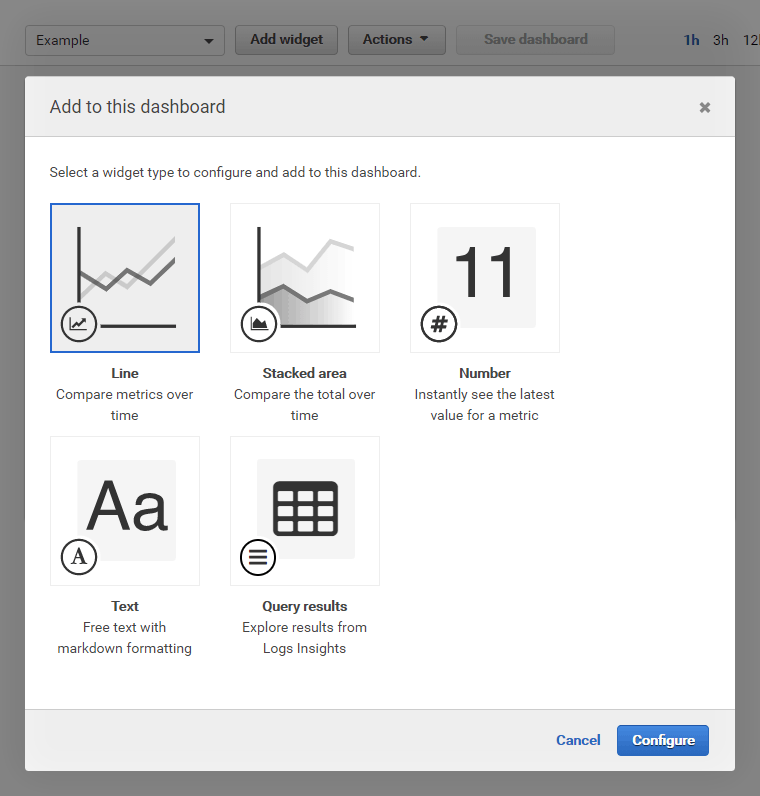
- Line is best for most cases, it’s a simple graph.
- Stacked area is more exotic, choose whichever you prefer.
- Number is useful to read out the current value.
- Text may be used for a title or your notes around the graphs.
Once you click Configure, CloudWatch presents you that interface where you clicked around to find a metric. For example, go down this path: Linux System -> InstanceId -> MemoryUtilization and click the row..
Metric graph setup
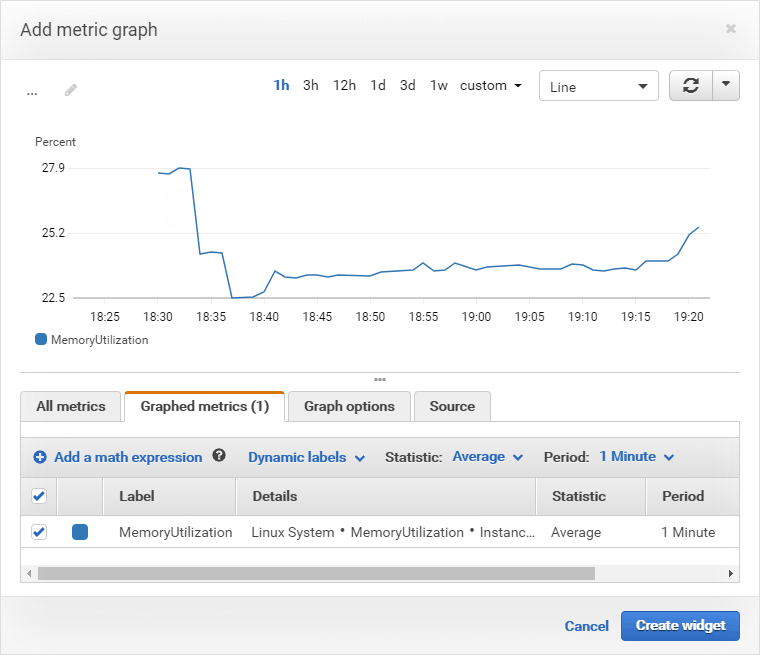
- If you don’t like the title as MemoryUtilization, you can rename it.
- If you chose the one-minute resolution (in the cron), select that period here accordingly.
- You can still switch between Line, Stacked area, and Number here so you can decide what you need.
- Notice that you can combine multiple metrics and graph them on the same widget.
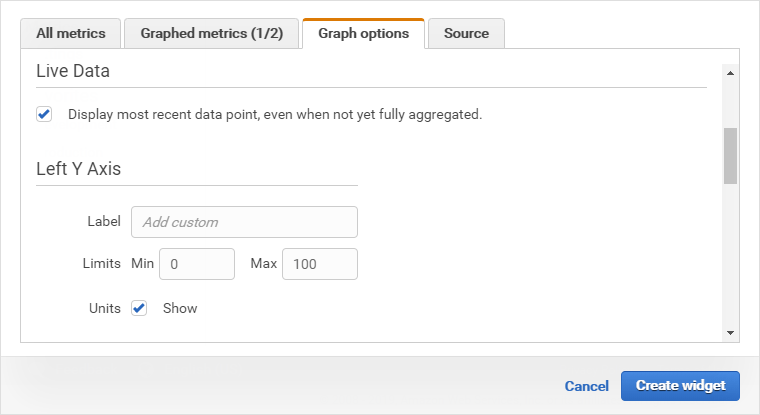
The Graph options tab holds tools for the most significant visual impact. Since the limit is known for EC2 memory and disk usage, you could enter them to the Max setting below (such as 16 for 16GB SSD or 2048 for 2GB RAM). Similarly, for percentage-based metrics, you might want to show the graph in the 0-100 rather than an automatically-adjusted range. You lose some resolution on the Y-axis that way, but you can better tell how far you are from the limits just by glancing at the dashboard.
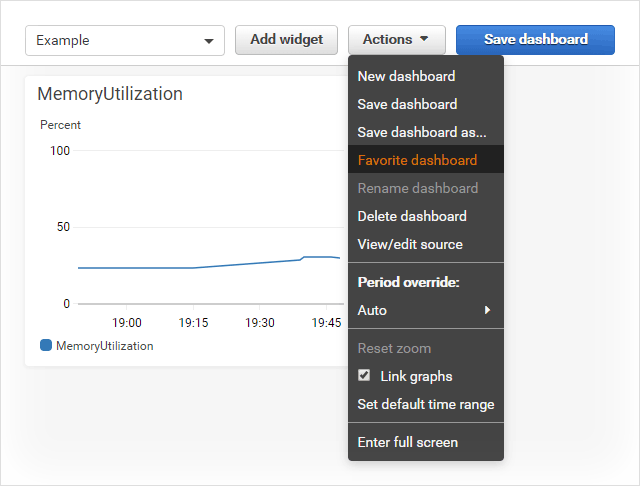
The Create widget button finalizes this step. Repeat this for each metric you wish to see and notice that you have access to the built-in ones such as CPU Utilization and so on. Fortunately, widgets can be rearranged, resized, renamed, edited. While you are here, you might want to mark this dashboard as favorite. More importantly, click Save dashboard!
Conclusion
In a nutshell, this is what happened… In Ubuntu, you installed a monitoring script which (thanks to cron) constantly sends data about your Amazon EC2 memory and disk usage to CloudWatch. You display these custom metrics on a dashboard as graph widgets. This setup helps you see otherwise hidden information so that you can provision your instance and its storage accordingly. Unless you want to sit in front of the dashboard all day, you might want to create some alarms. Since this already became Tolstoy’s War and Peace, I’ll leave you to celebrate.